

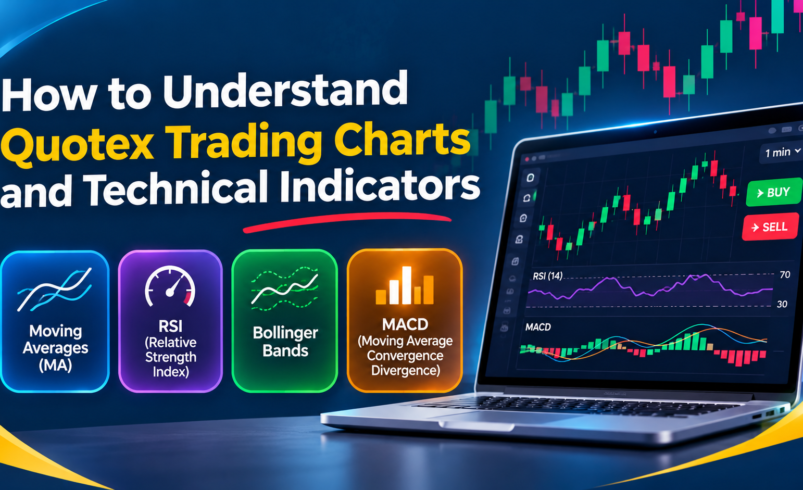

Understanding trading charts and technical indicators is essential for beginners who want to learn about online trading. The Quotex trading platform provides charting tools that help users analyse price movements, identify market trends, and explore trading strategies. Learning how these tools work can help traders make more informed decisions while understanding the risks involved in financial markets.
What Are Quotex Trading Charts?
Quotex trading charts visually represent price movements over different time periods. These charts help users observe historical market behaviour and understand how asset prices fluctuate.
The most commonly used chart types include:
- Line Charts: Display price movements through a continuous line, making it easier to identify general trends.
- Candlestick Charts: Show opening, closing, highest, and lowest prices within a specific time period.
- Bar Charts: Present price information using vertical bars, helping users analyse market fluctuations.
Candlestick charts are particularly popular because they provide detailed information about price movements.
Understanding Technical Indicators on Quotex
Technical indicators are analytical tools that use historical price data to help traders identify trends, momentum, and potential changes in market direction.
Some commonly used indicators include:
1. Moving Averages (MA)
Moving averages calculate the average price of an asset over a selected period. They help smooth price fluctuations and identify overall market trends.
2. Relative Strength Index (RSI)
The RSI measures price momentum on a scale from 0 to 100. Readings above 70 are commonly considered overbought, while readings below 30 are considered oversold. However, these readings do not guarantee price reversals.
3. Bollinger Bands
Bollinger Bands consist of a moving average and two surrounding bands. They help traders observe price volatility and identify periods of relatively high or low market activity.
4. Moving Average Convergence Divergence (MACD)
MACD is a momentum indicator that helps users analyse the relationship between moving averages and identify potential trend changes.
How Beginners Can Practise Chart Analysis
Beginners can use a Quotex demo account to explore trading charts and technical indicators without risking actual money.
Start by selecting an available asset and observing its price movements. Experiment with different chart timeframes, apply indicators, and compare their signals with historical market behaviour.
Keeping a record of simulated trades can also help users evaluate their understanding and recognise common mistakes.
Important Risk Management Tips
Technical indicators are not always accurate, and financial markets can behave unpredictably. Beginners should avoid relying on a single indicator when analysing market conditions.
Learning basic risk management, understanding market volatility, and practising disciplined decision-making are important parts of trading education.
Conclusion
Learning to understand Quotex trading charts and technical indicators can help beginners develop a stronger foundation in market analysis. Tools such as Moving Averages, RSI, Bollinger Bands, and MACD provide useful insights into historical price behaviour.
For more information about Quotex trading features and educational resources, visit QX Trading.
Disclaimer: This article is for educational purposes only and does not constitute financial advice. Trading digital options involves substantial risk, including the potential loss of invested funds.